1.0 Introduction
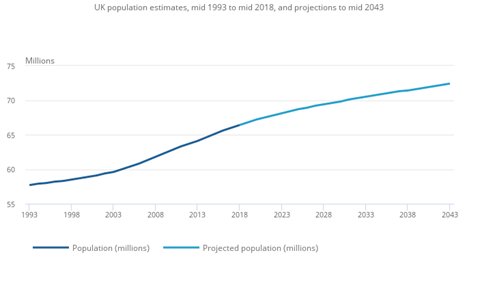
The United Kingdom has been battling with a housing crisis for decades. This is due to the lack of balance between demand and supply for housing as a result of rapid population growth. The UK’s population is projected to grow to 72.4 million by 2043 (Nash, 2019). As a result, proactive steps must be taken in order to meet the housing needs.
201,000 new homes were built in the twelve months to June 2025, according to EPC (Energy Performance Certificate) data. That leaves completions broadly unchanged since the previous quarter, with the smallest quarterly fall in over a year. Nevertheless, the number of new homes completed remains 8% lower than 12 months ago and lower than at any point since 2016 (English Housing Supply Update Q2 2025, 2025).
However, while trying to fix the challenges posed by the housing crisis, caution must also be taken to avoid sacrificing quality for quantity. Sustainable housing is one of the most talked about in the world among global leaders and stakeholders in the real estate industry. One of the most pressing challenges facing the UK’s urban planning sector is how to allocate land for sustainable housing developments.
Despite the growth of interest in the sustainability of urban environments over the last few decades, there has also been criticism that not enough has been done to conceptualise the meaning of “sustainable housing”. As a consequence, the term continues to be widely used to describe housing with a lower environmental impact (such as housing with enhanced energy efficiency features), while other sustainability aspects, especially social (including health and well-being), economic and cultural factors, are largely overlooked (Prochorskaite et al., 2016).
For any housing development to be termed “sustainable”, it must be environmentally safe (i.e. safe from flooding and terrain risks) and socially accessible (i.e. within proximity to existing infrastructural developments).
This study focuses on Exeter, a city in Devon, South-West England with a population of 130,700 in 2021 as at the 2021 Census. In 2021, Exeter was home to around 19.8 people per football pitch-sized plot (approximately 7,140 sqm), compared with 17.9 in 2011. This area was among the top 25% most densely populated English local authority areas at the last census (How life has changed in Exeter: Census 2021).
Exeter is a perfect case study for the need to create a balance between housing needs and environmental protection. It is well-known for complex topography that ranges from the low-lying and flood-prone valley of the River Exeter to the steep gradients of the northern hills such as Pennsylvania and Exwick.
2.0 Methodology
2.1 Methodology
R was selected as the preferred programming language for this spatial analysis while QGIS was used to visualise the results and also design the figures from the raster and vector files exported at the end of the analysis.
Five R packages (See Table 1) were used and installed in an RStudio environment before loading the input data and pulling other data through from the OpenStreetMap database.
| R Packages | Description |
| osmdata | It enabled automated data retrieval. Used to query the OpenStreetMap Overpass API to fetch live infrastructure data (schools, roads, hospitals and supermarkets) directly into the R environment. |
| terra | It is used for high-performance raster processing. It handled the LiDAR DTM, calculated the slope surface, and performed the final suitability scoring. |
| sf | It is used for handling vector data (points, lines, and polygons) representing the roads, schools, hospitals and supermarkets. It is also used for reading shapefiles, performing coordinate transformations st_transform, and cropping flood zones to the study area using st_crop |
| tidyverse | This is a collection of R packages (including dplyr). It was used for filtering out invalid records from the attribute tables of the vectors downloaded from OpenStreetMap via the Overpass API. |
| tmap | It is used for generating static maps with professional layout elements (grids, north arrows, scale bars) when visualising the results. |
Table 1: Showing the R packages used for the spatial analysis
2.2 Data Collection
A total of six data were collected for this analysis. Risk of Flooding from Rivers and Sea data was downloaded as a shapefile from the Defra Data Services Platform (Defra Data Services Platform, 2024) into the working directory (check the GitHub repository) and renamed “rofrs_4band_Exeter.shp”.
Additionally, the LIDAR Composite DTM for 2022 with 1m resolution was downloaded from the survey page of the same platform (https://environment.data.gov.uk/survey) into the working directory and was renamed “Exeter_DTM_1m.tif”.
The remaining four data (roads i.e. public transport, hospitals, supermarkets and schools) were downloaded in RStudio using the osmdata R package to access the OpenStreetMap’s database through the Overpass API (Check the GitHub Repository).
2.3 Data Analysis
The analysis was based on the Multi-Criteria Decision Analysis (MCDA). A more simplified Weighted Linear Combination technique was used and the input variables were grouped into two distinct classes: constraints (flood and slope) and opportunities (nearness to amenities such as roads, schools, supermarkets and hospitals).
Final Suitability Score = (Roads + Schools + Markets + Hospitals) x (Flood x Slope) i.e Amenities x Constraints
The slope was calculated from the DTM. Areas within the flood zones and those with terrain steeper than 10° were treated as constraints. The suitability of a site depends so much on these constraints. A score of 1 was assigned to the absence of flooding occurrences and if the slope is less than 10°. On the other hand, a score of 0 was assigned to the presence of flooding occurrences and a slope greater than 10°.
For the amenities, an equal weight of 1 was assigned to every amenity based on Euclidean (straight-line) distance. A suitability score of 1 was assigned to sites within the distance threshold. On the other hand, a suitability score of 0 was assigned to sites outside the set threshold.
A distance threshold of 500m was assigned to roads. This is equivalent to about a 5-minute walk, a maximum distance an average resident would likely be willing to walk to access a bus stop before opting for a private car.
For schools and supermarkets, the distance threshold was increased to 1000m (1km). This is equivalent to approximately 10–15 minute walk or a very short cycle ride. This 1000m radius ensures that residents are within close proximity to primary and secondary schools and fresh food without relying on motorised means of transportation.
For the hospitals, a distance threshold of 2000m (2km) was assigned. This threshold was increased to 2000m because setting a threshold of 500m or 1000m for hospitals is unrealistic. While schools and hospitals are neighbourhood amenities, hospitals are city-wide amenities and are usually located centrally.
3.0 Results and Discussion
The constraint analysis successfully identified No-Build zones. The Slope Analysis (Figure 2) highlights the steep topography surrounding the Exe valley, specifically the hills to the northwest (Exwick) and the ridges to the east. When compared with the flood risk analysis (Figure 1), these constraints significantly reduce the available land for sustainable housing developments in Exeter.
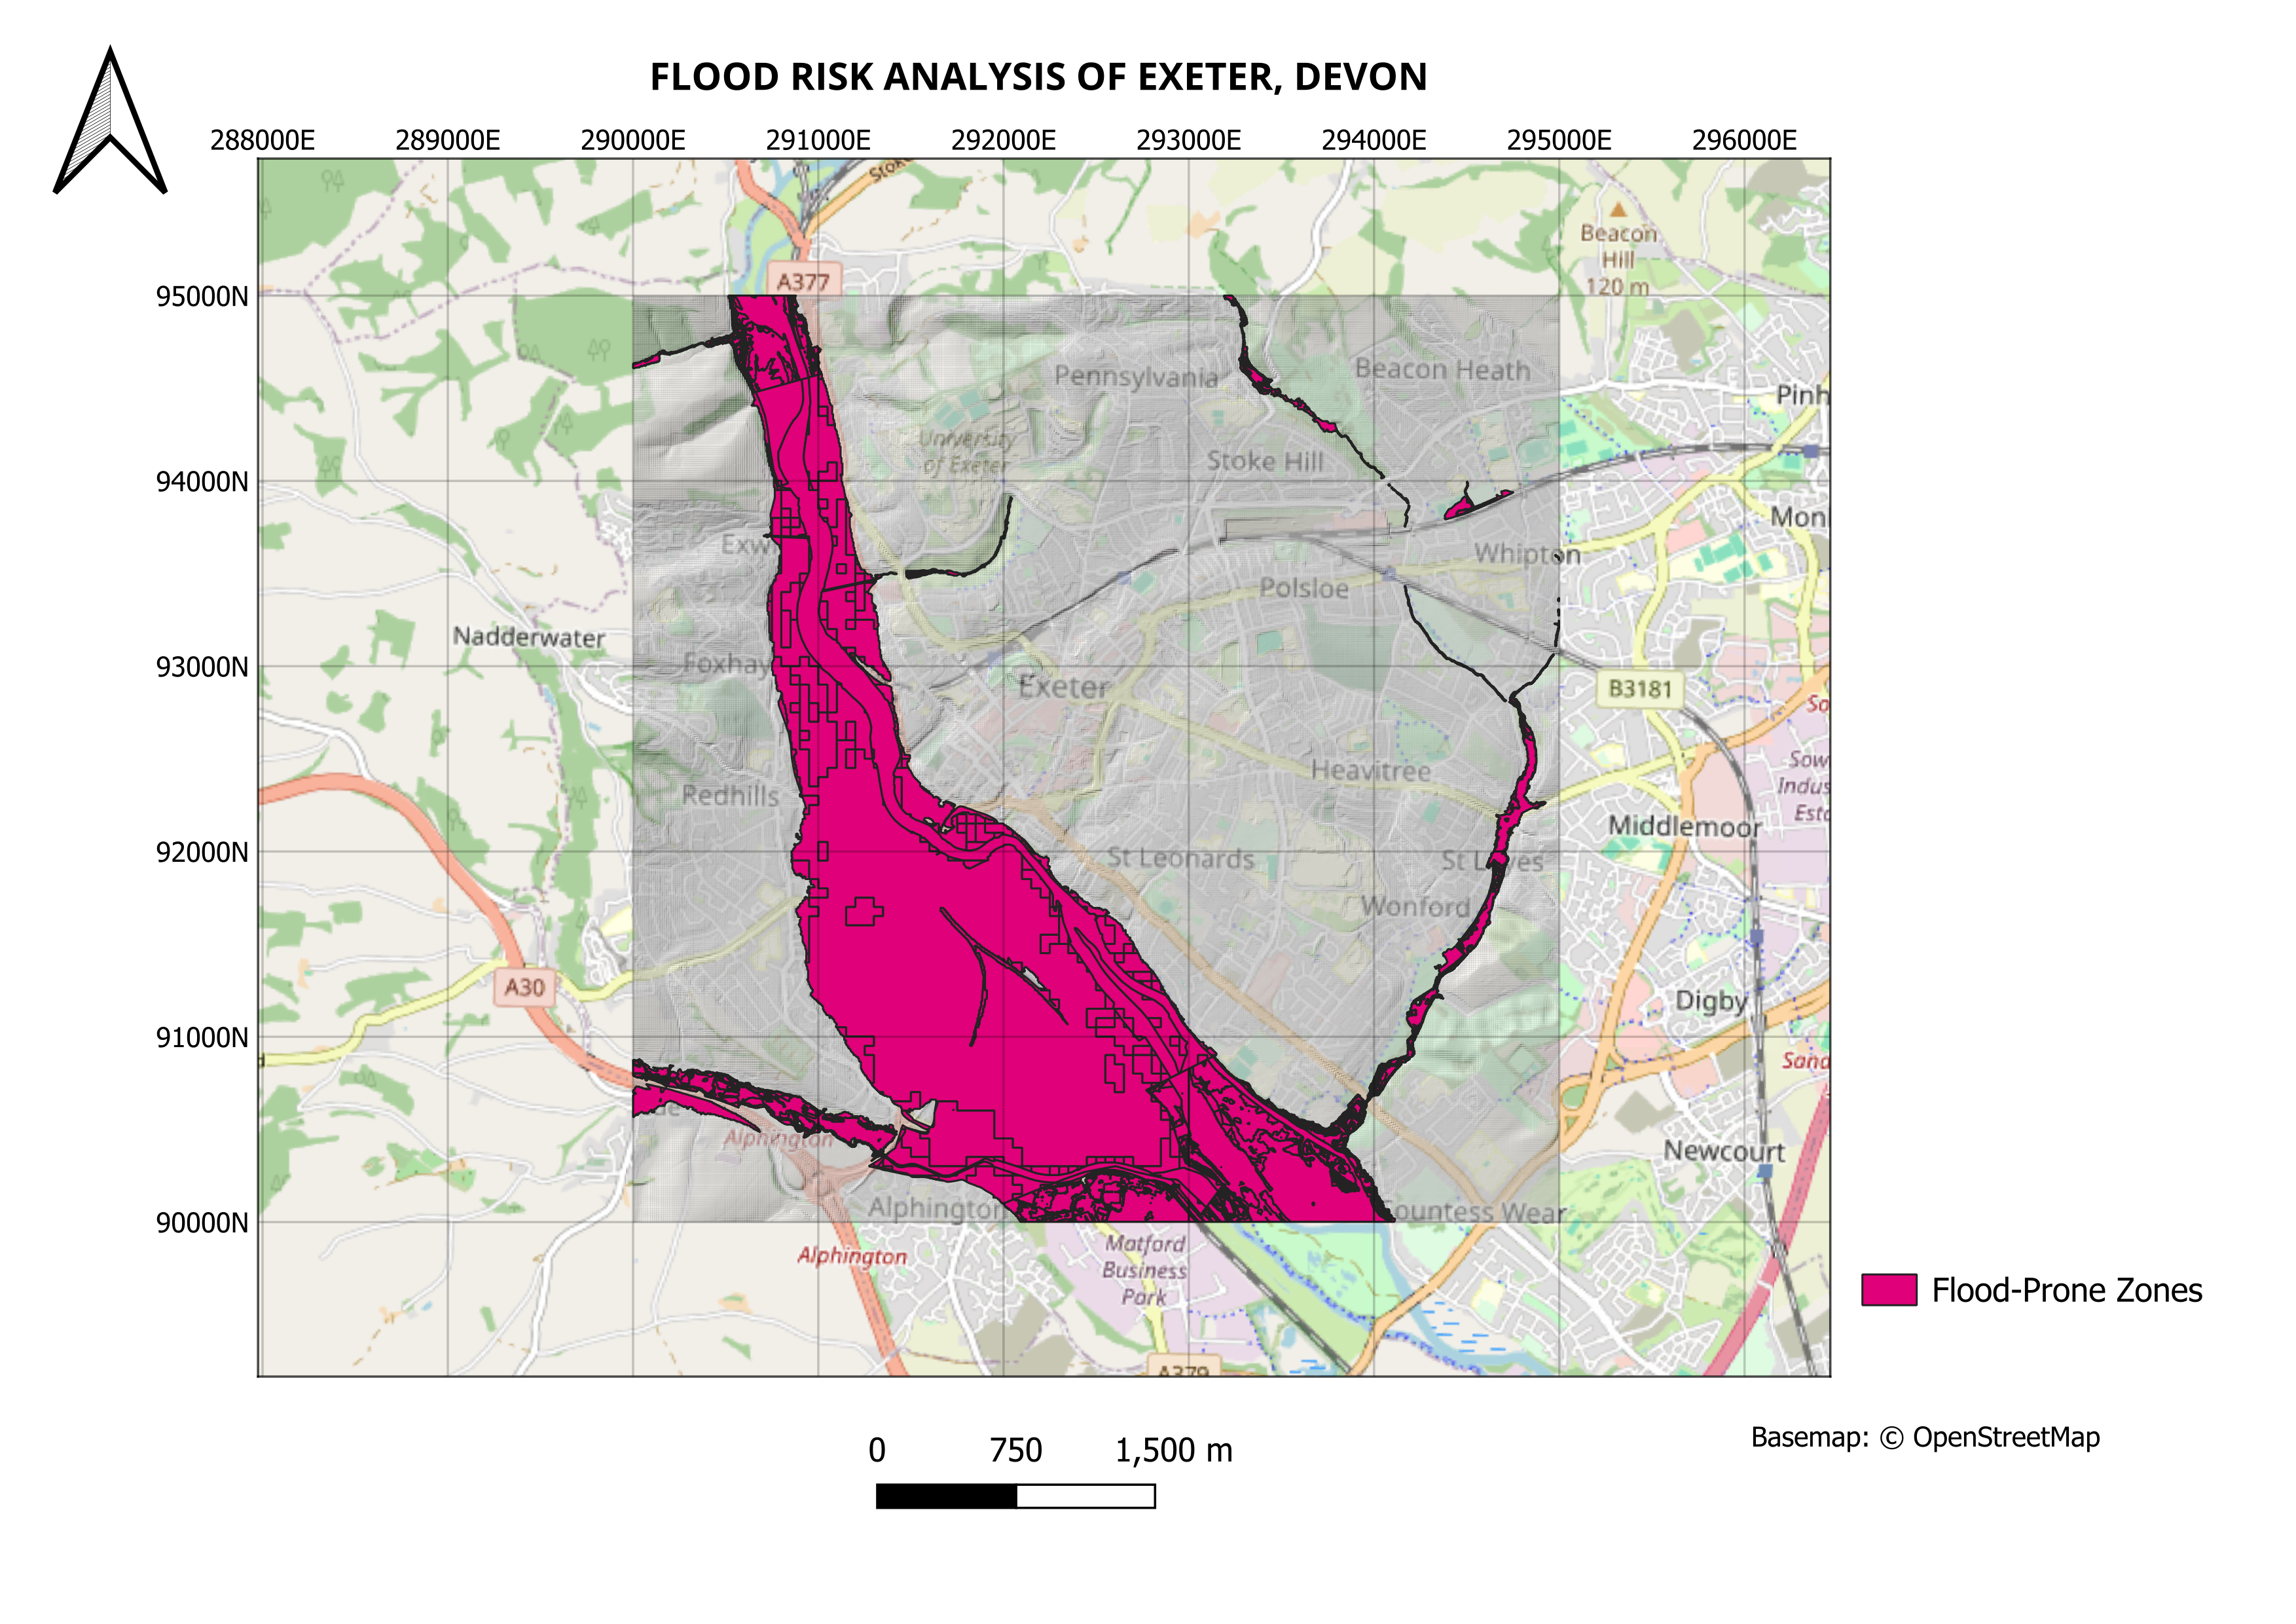
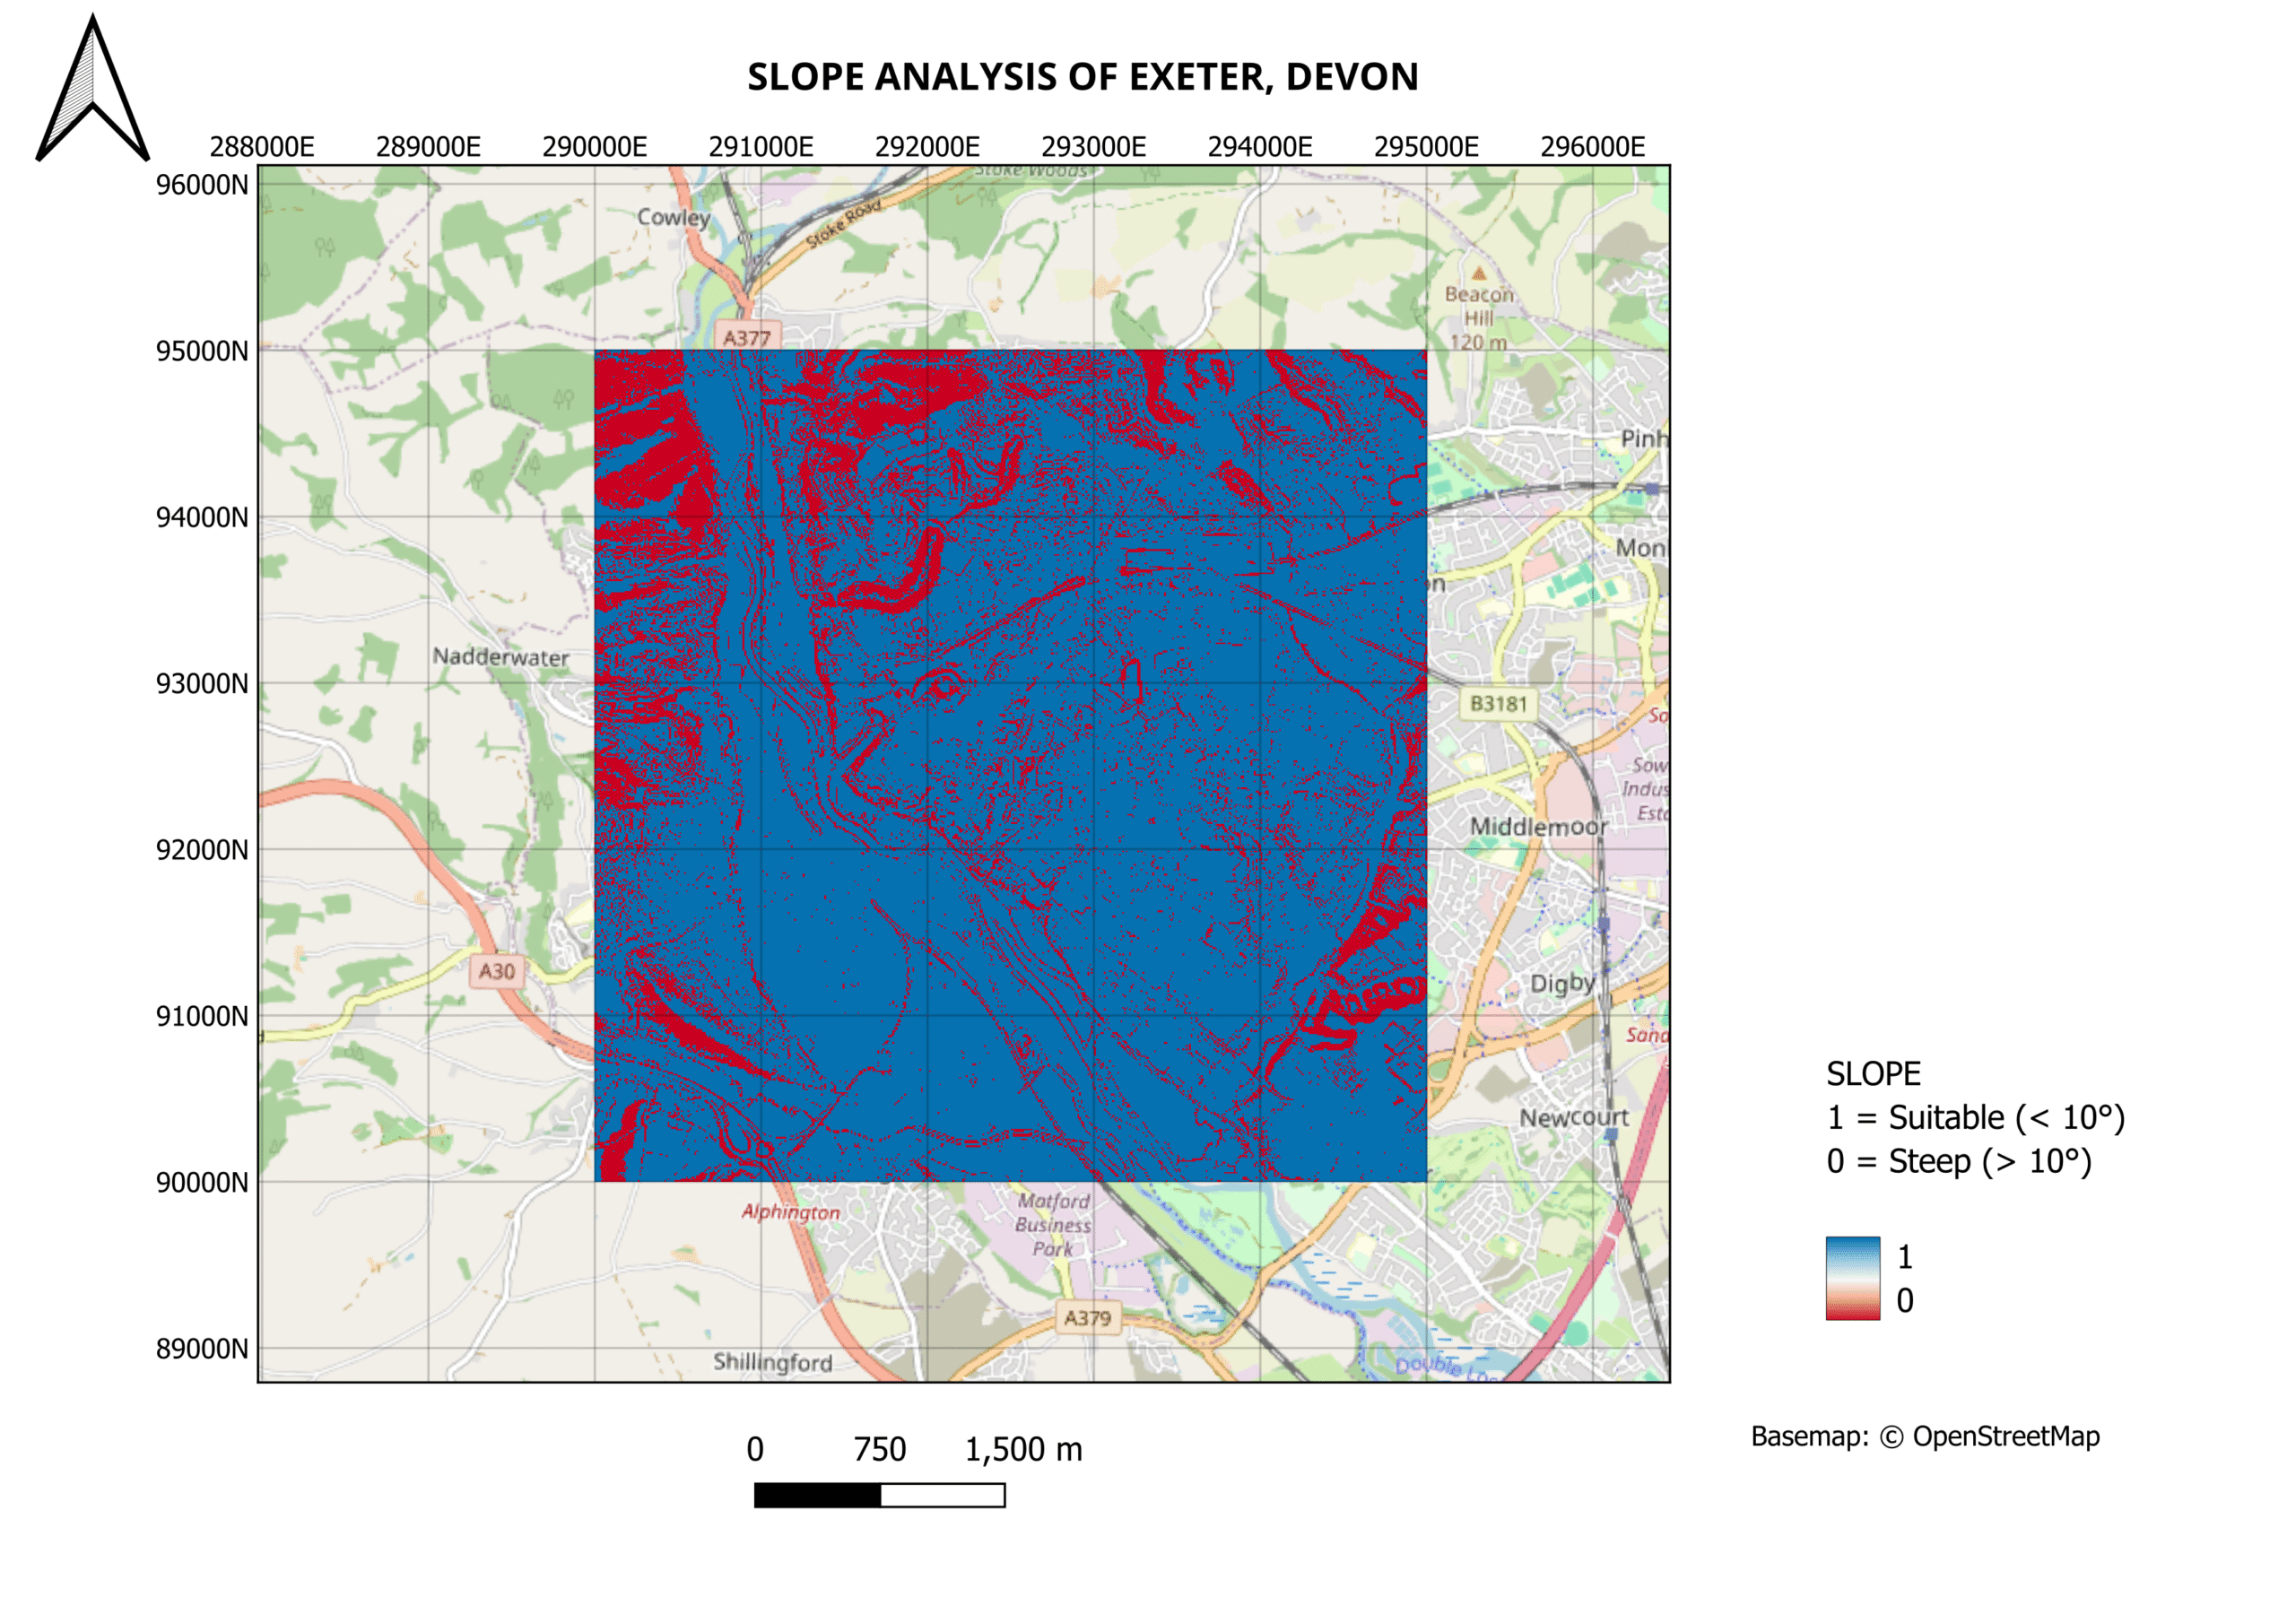
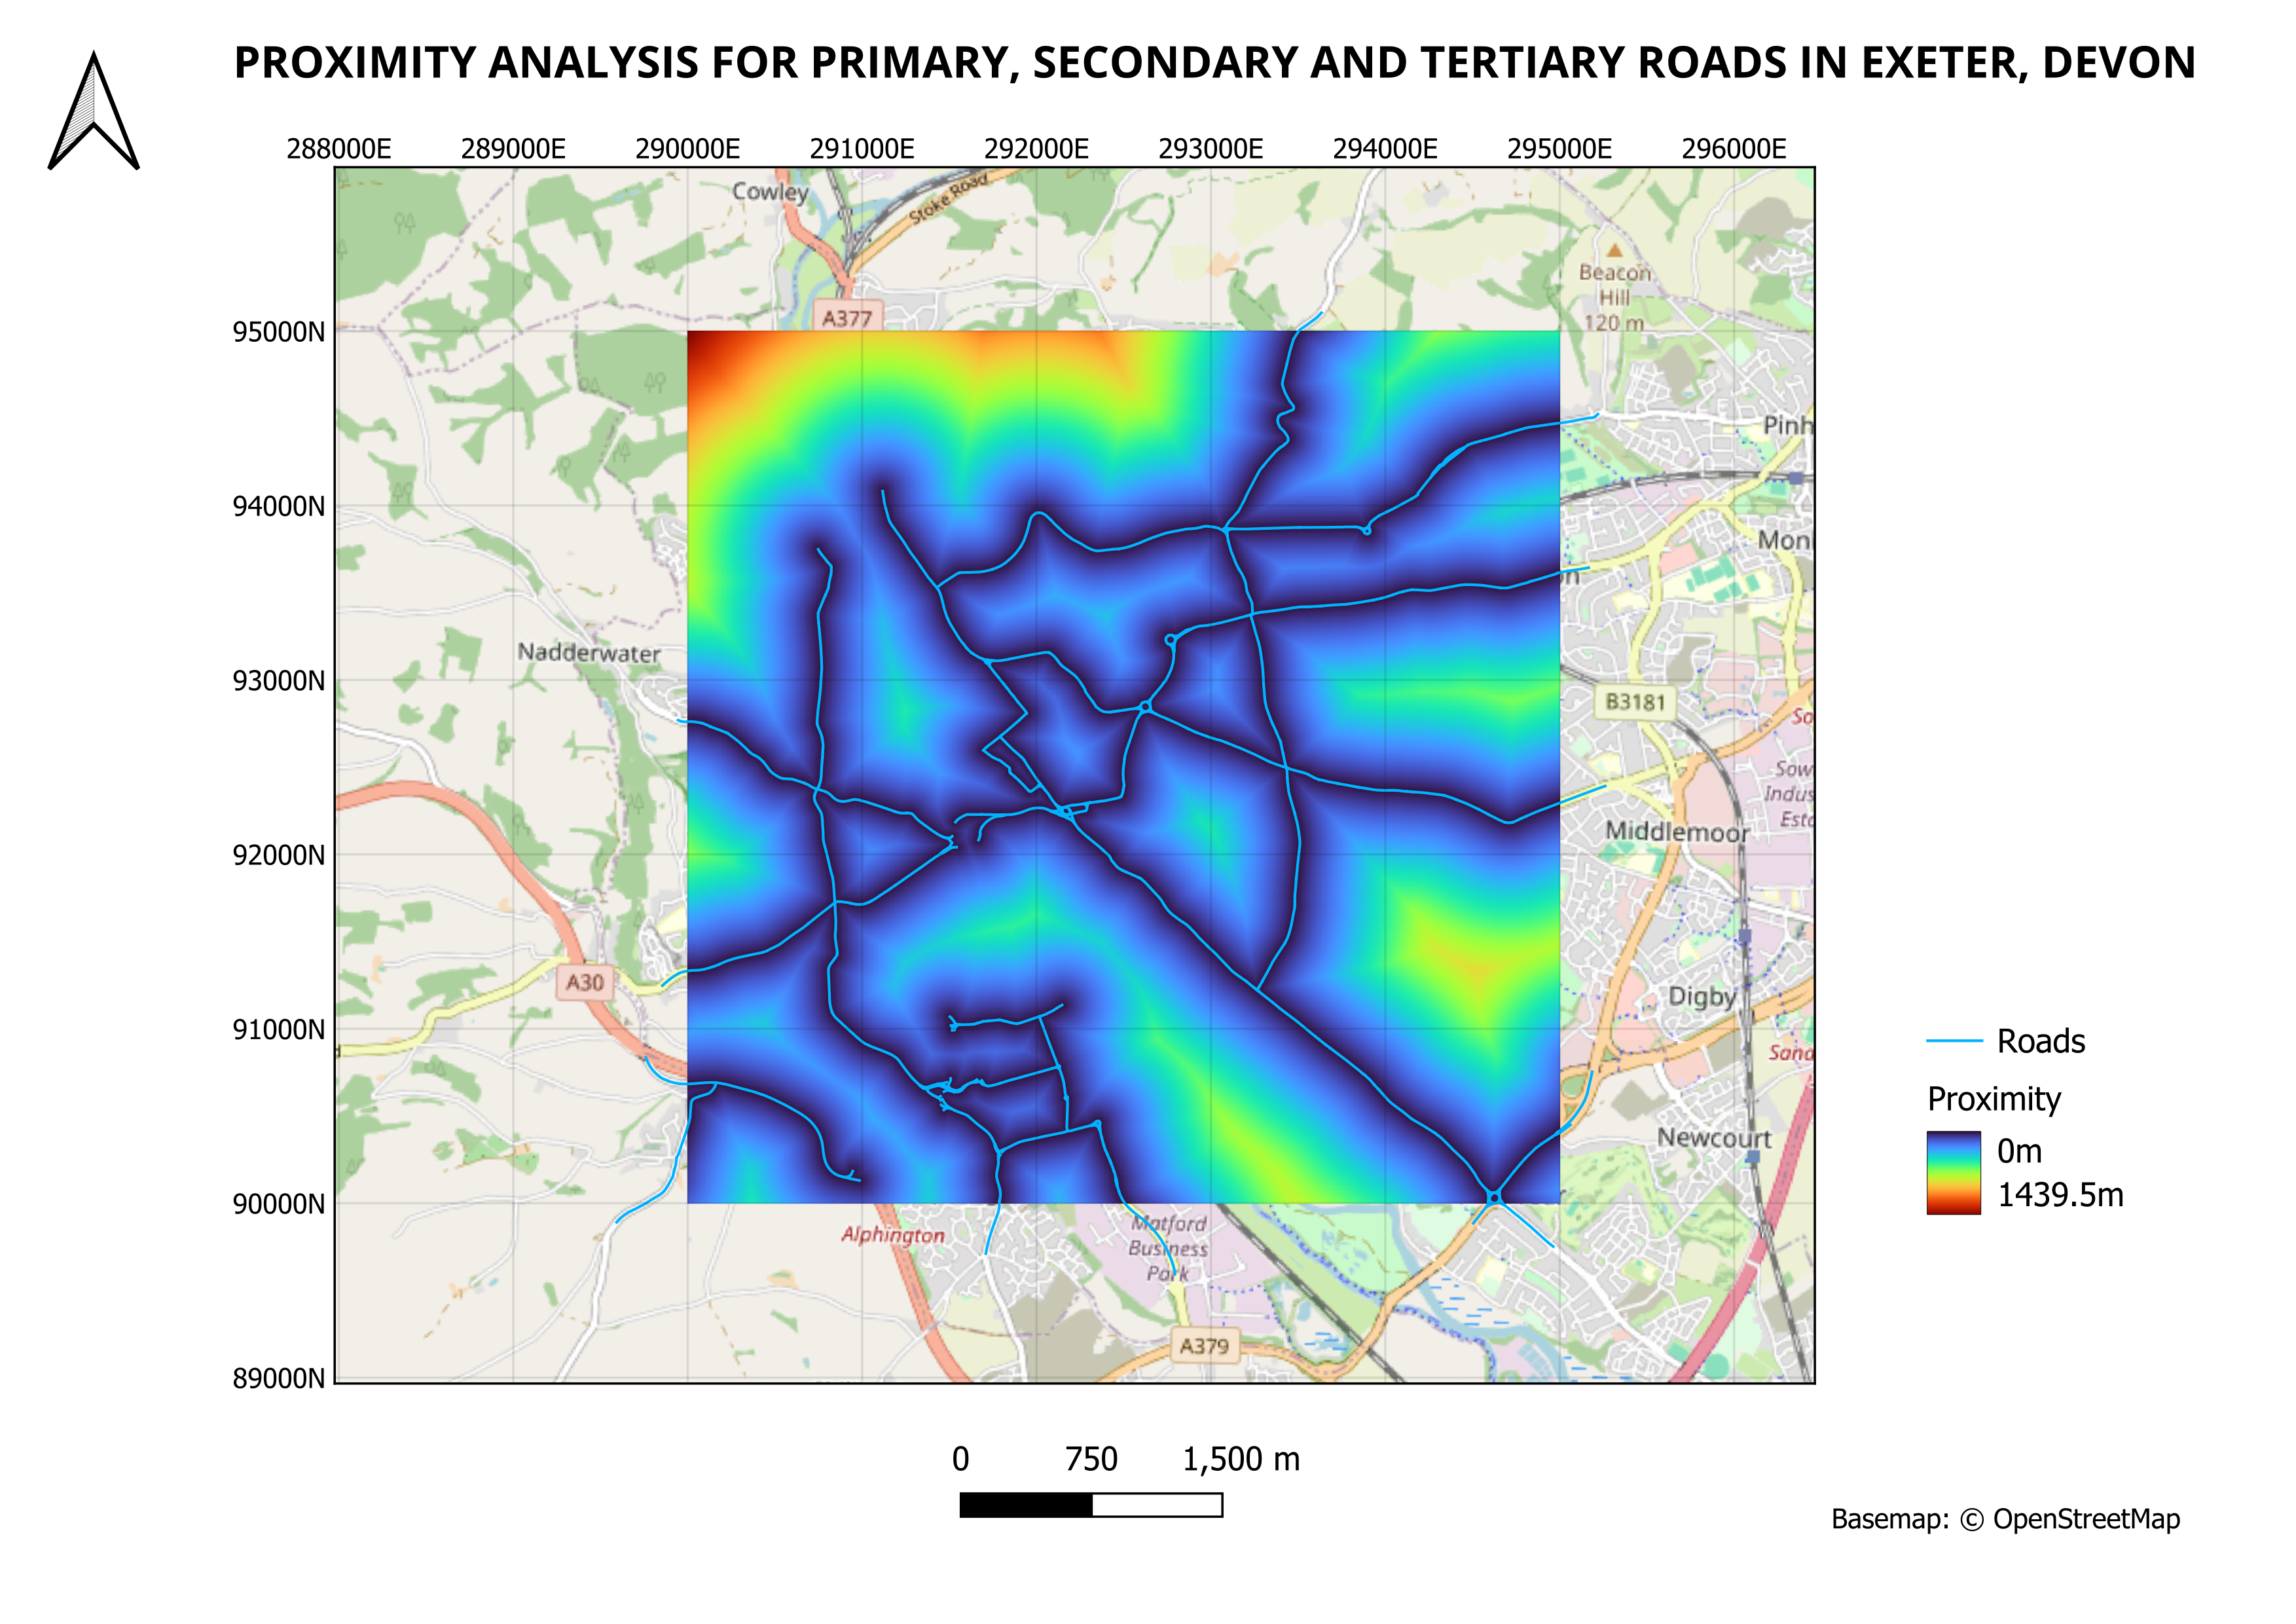
Figure 3: Heatmap of Exeter locations with proximity to public transport
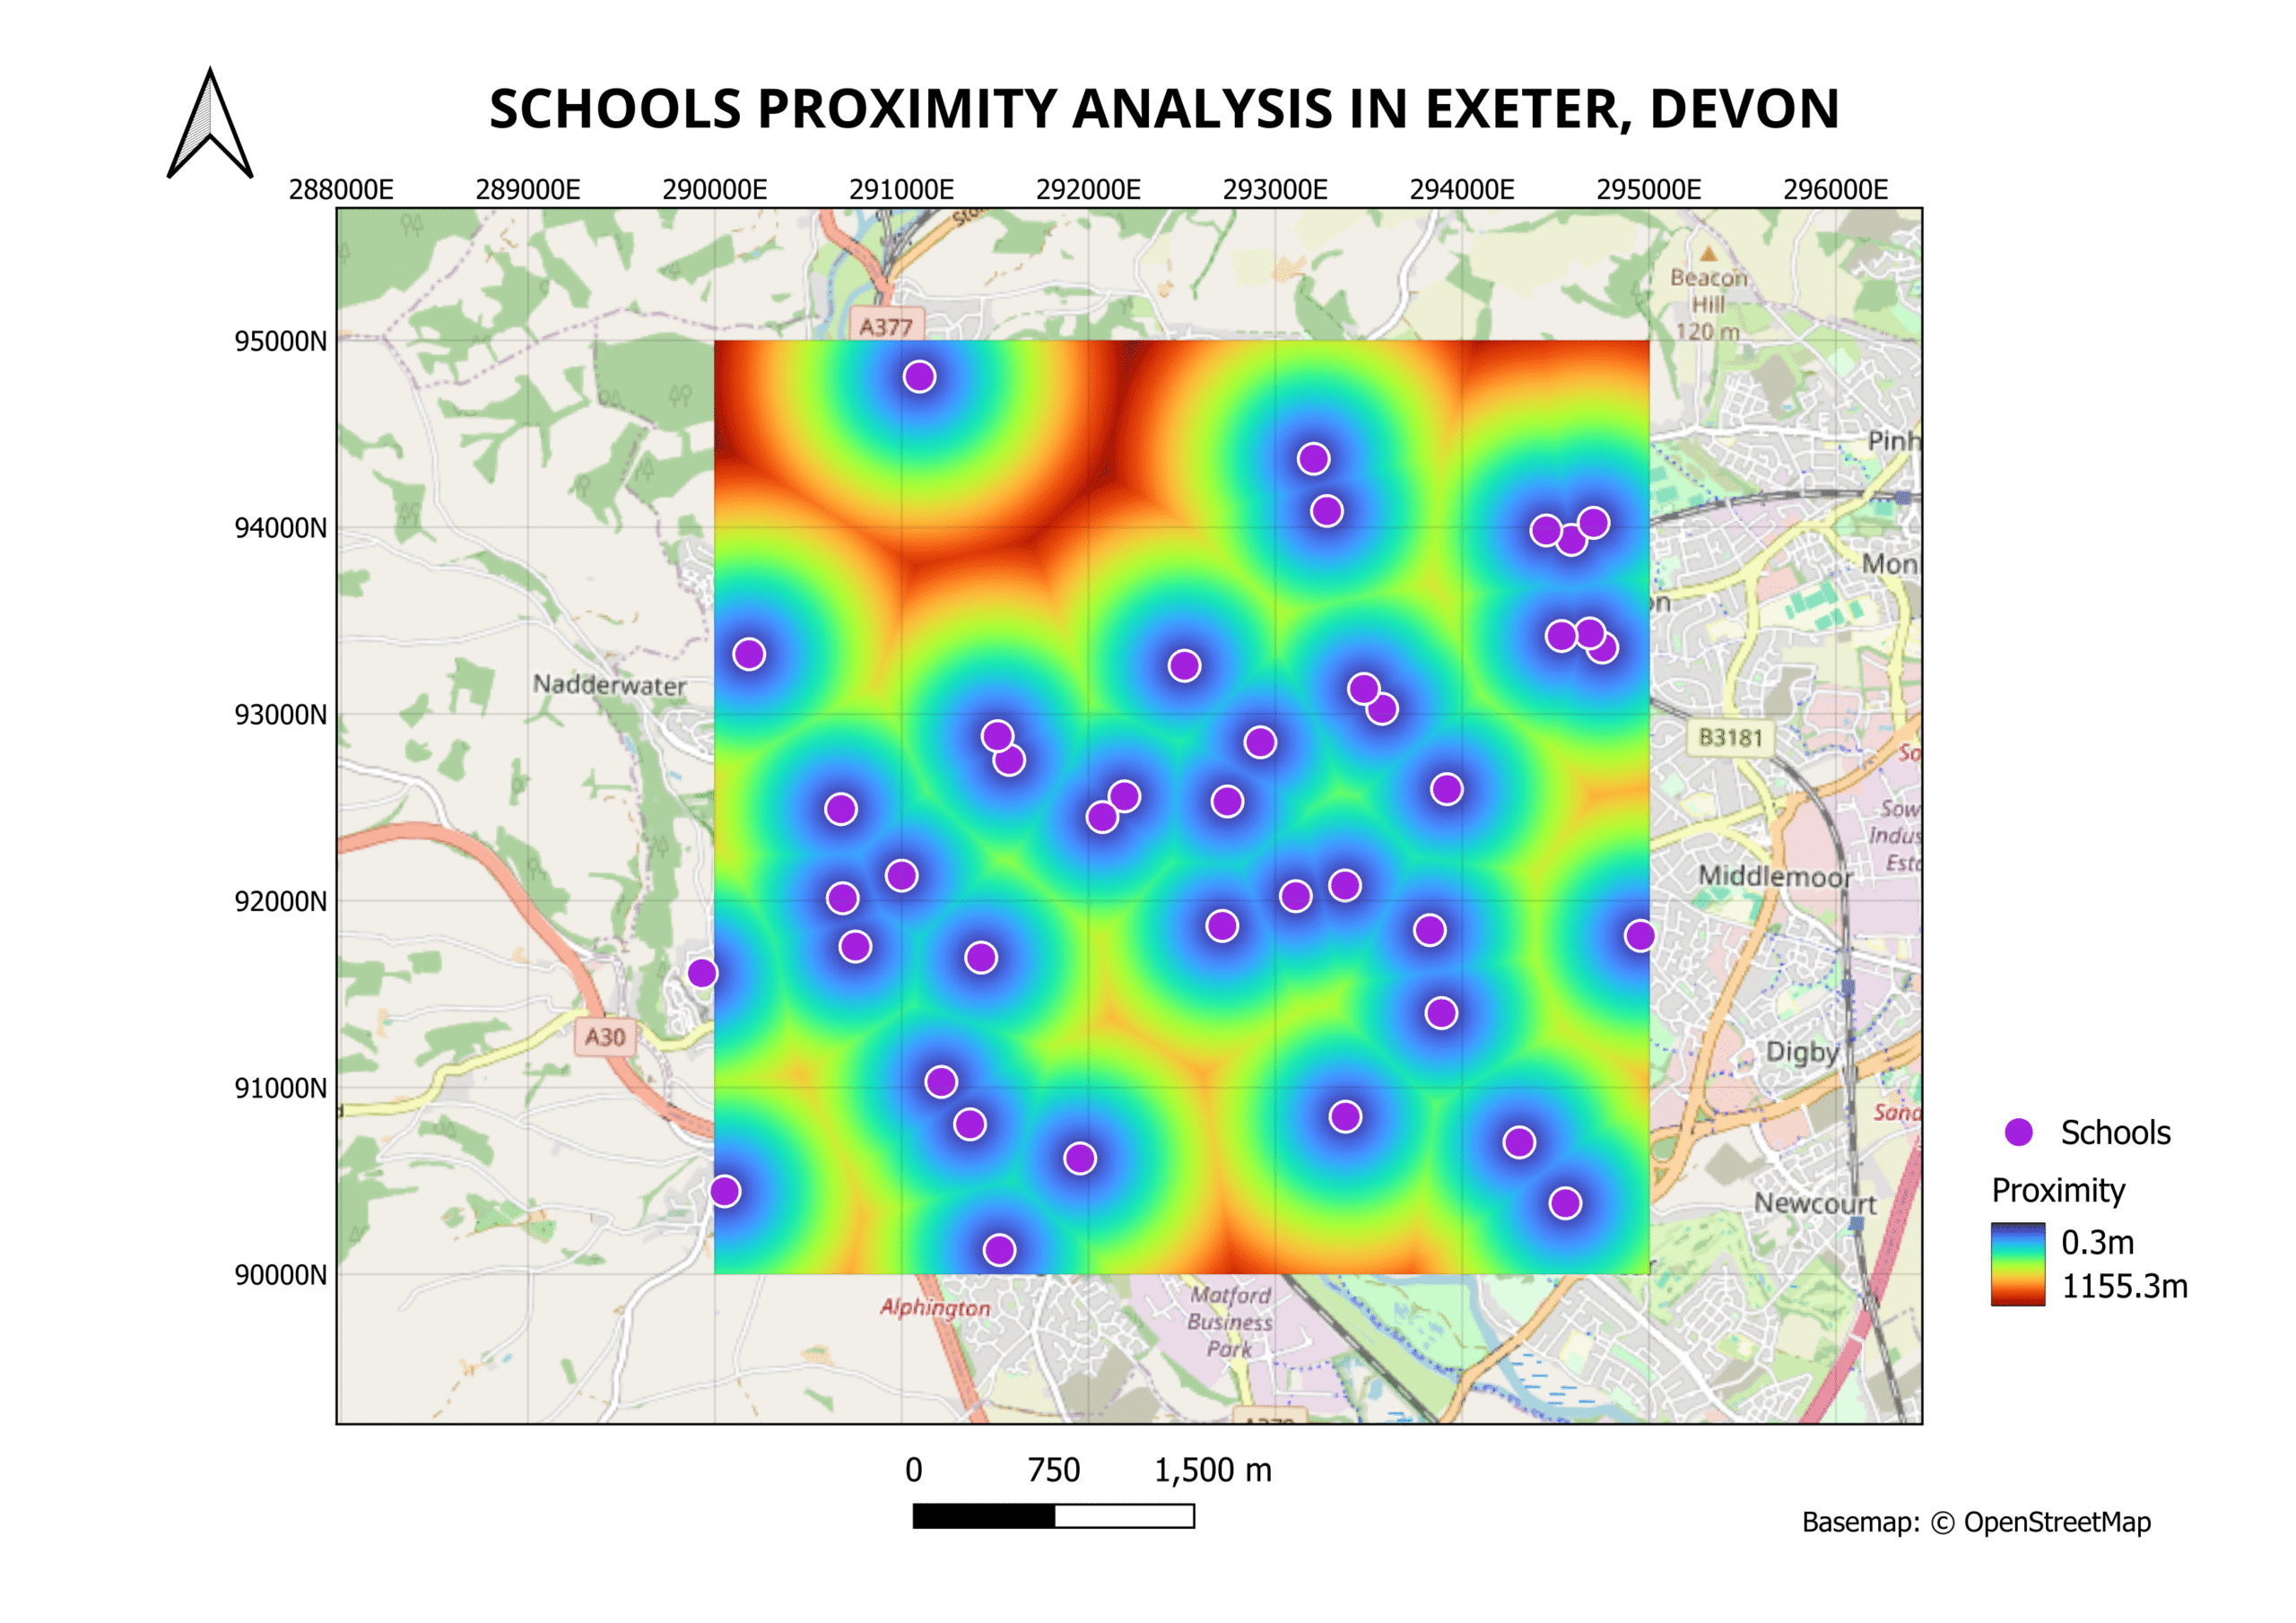
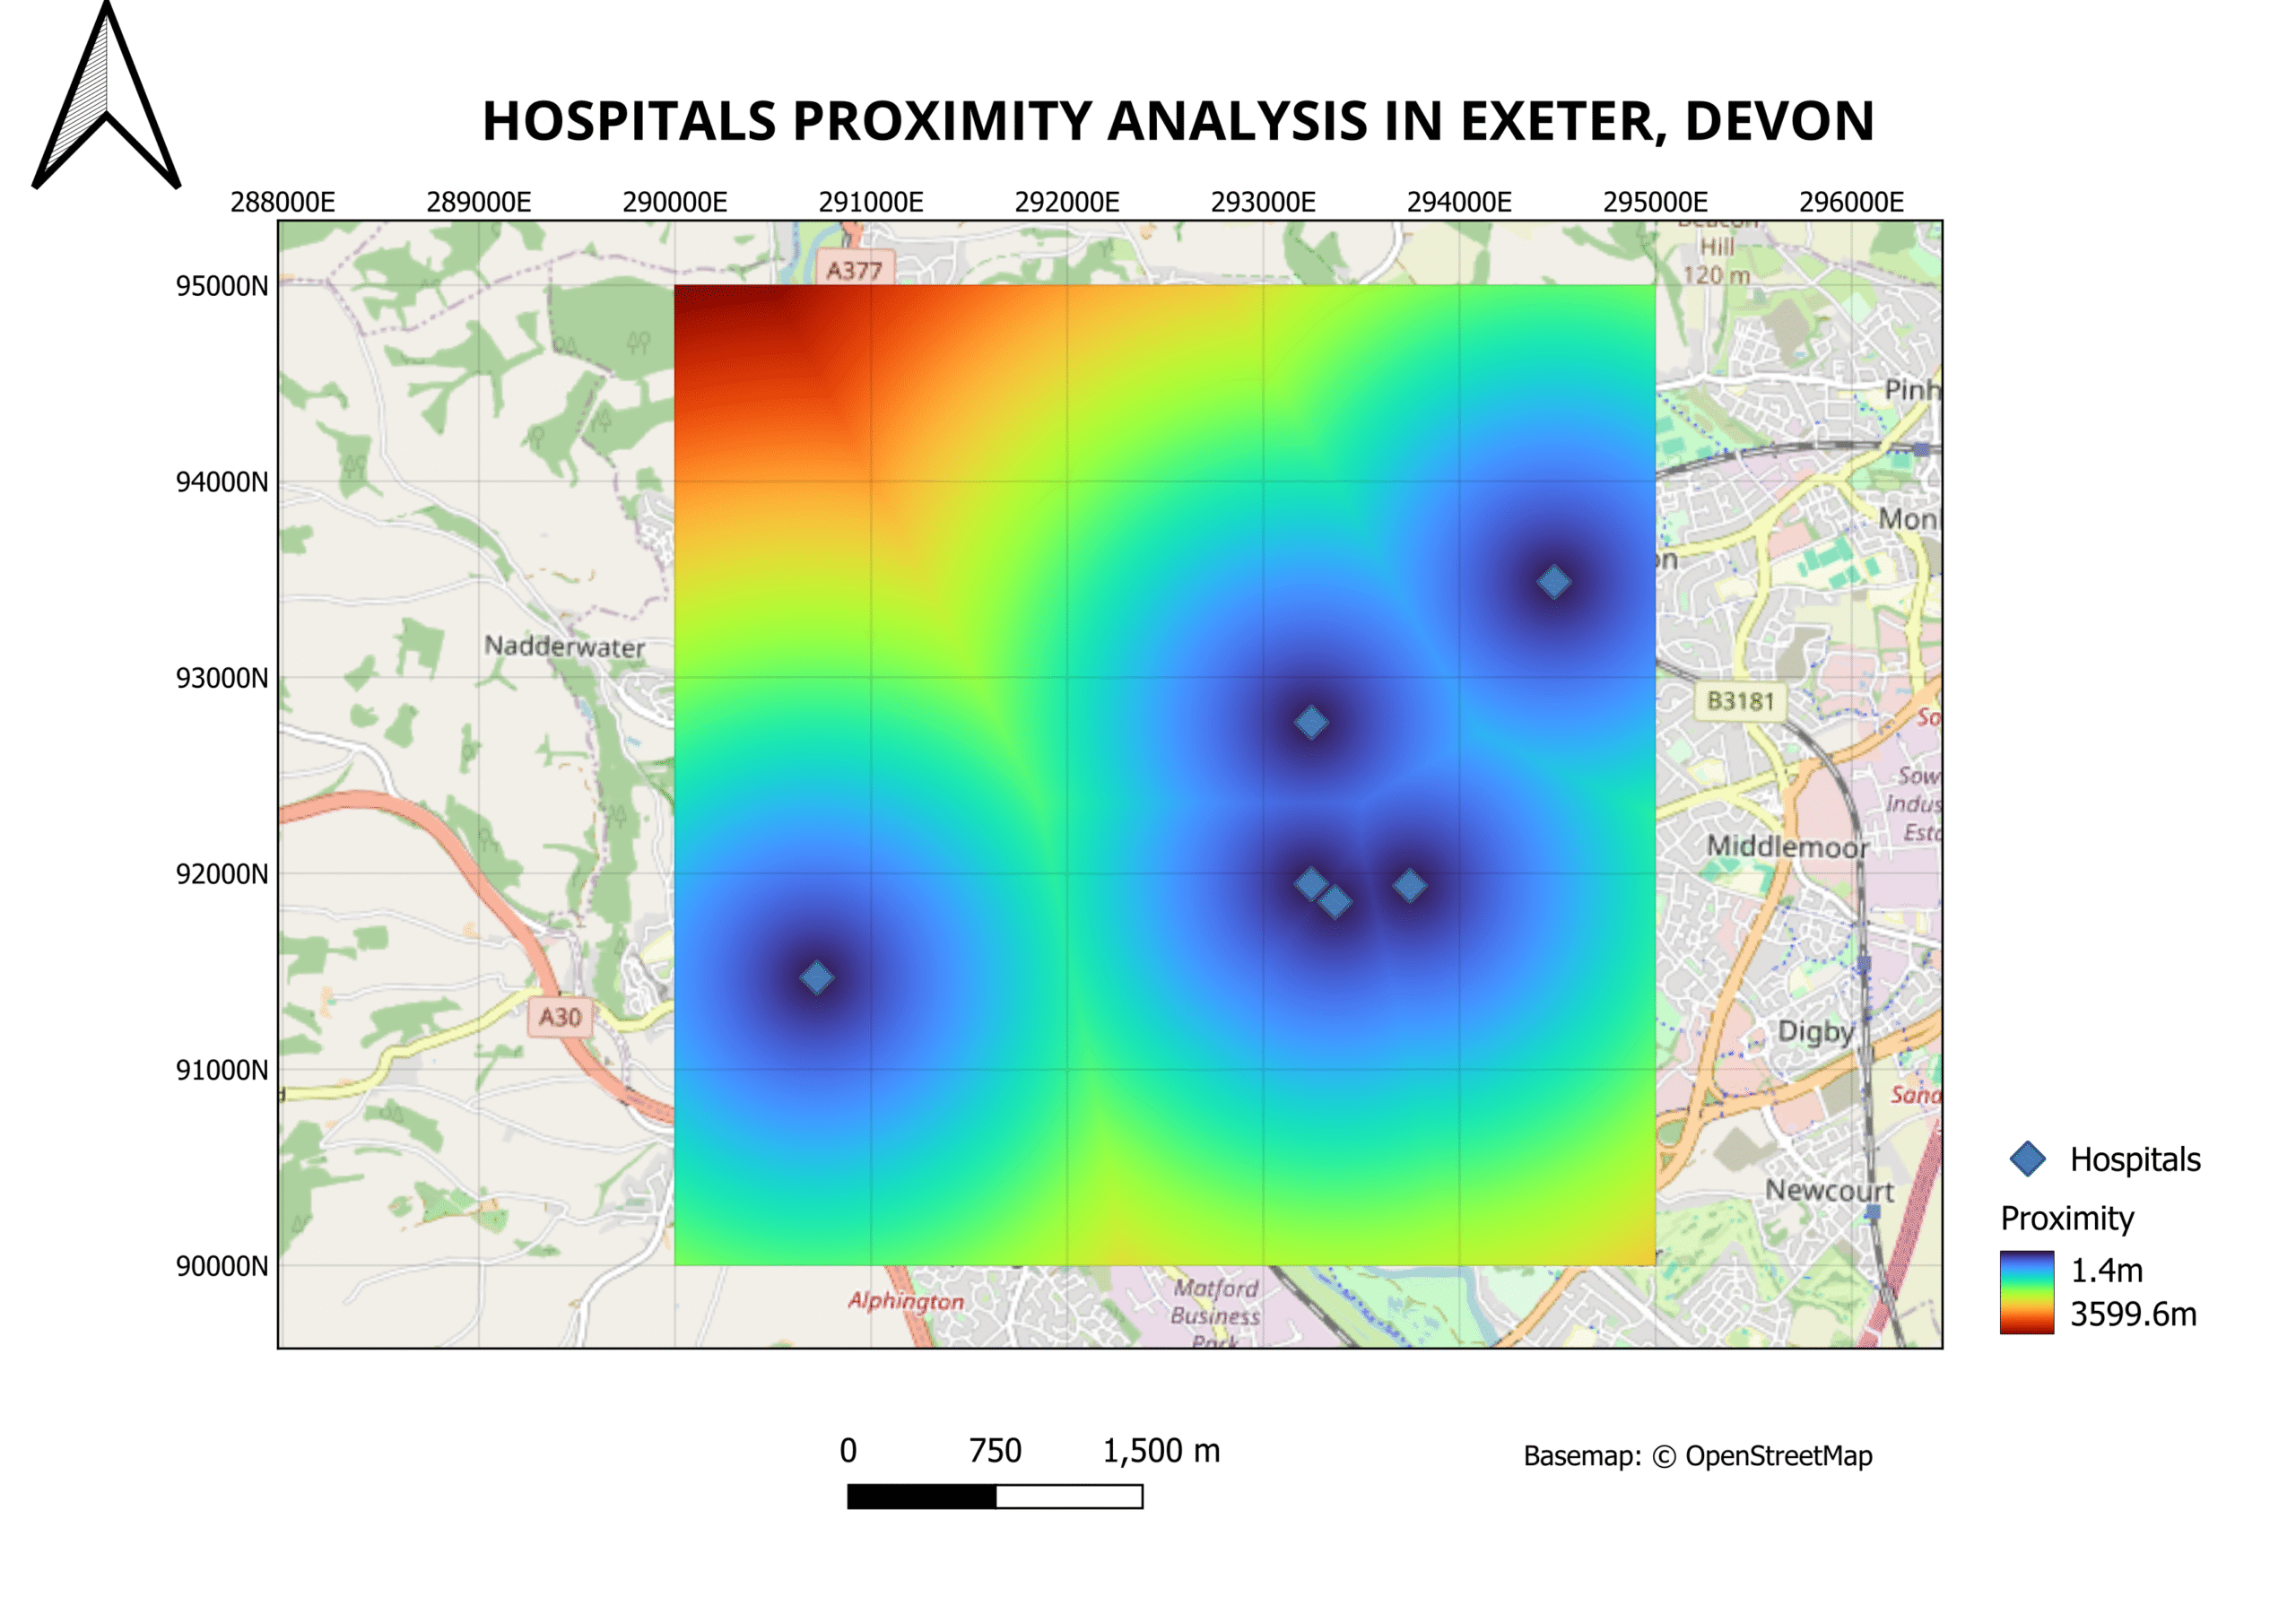
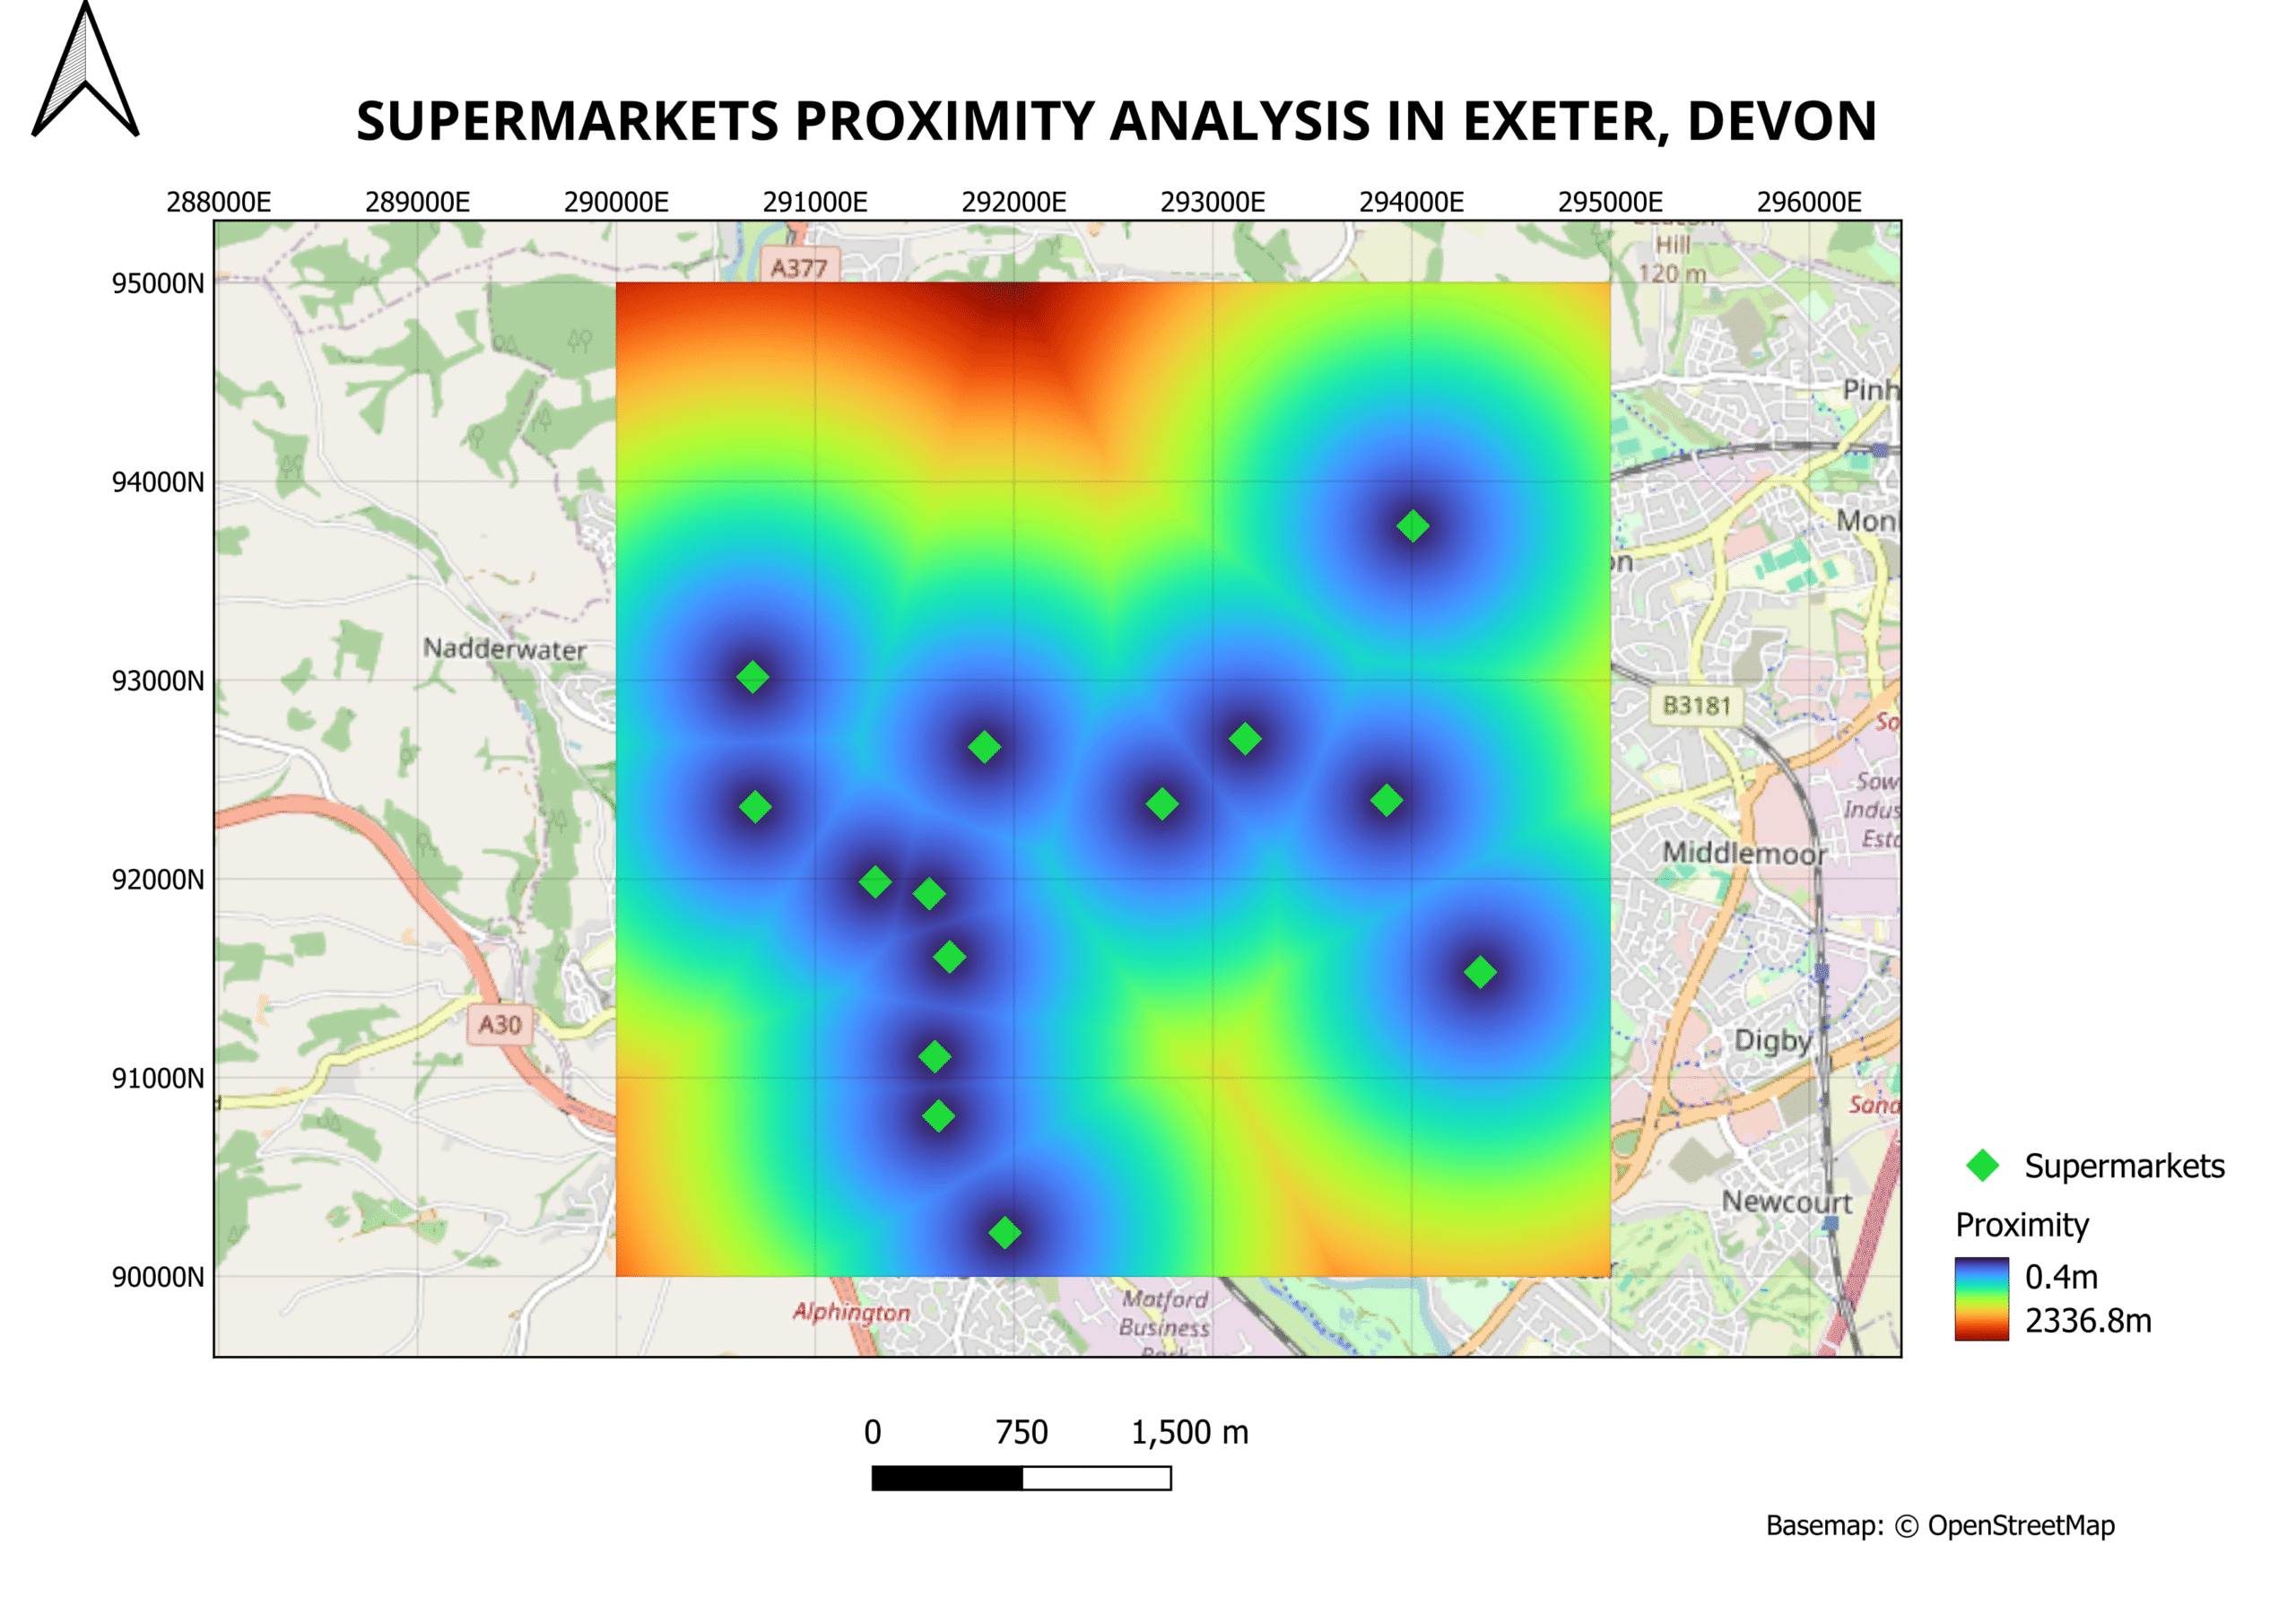
Figure 6: Heatmap of Exeter locations with proximity to supermarkets
The final suitability score map shows how the amenities are clustered in those locations. The final output (Figure 7) aggregated the factors considered into a single suitability map. The dark green areas represent sites that meet all four amenity criteria while avoiding all constraints. These prime locations are notably clustered around the Heavitree and Wonford (294,000E, 92,000N) areas. This score is driven largely by their score on the slope and flood analysis, including the hospital proximity which also overlaps with the dense road network and proximity to schools and supermarkets
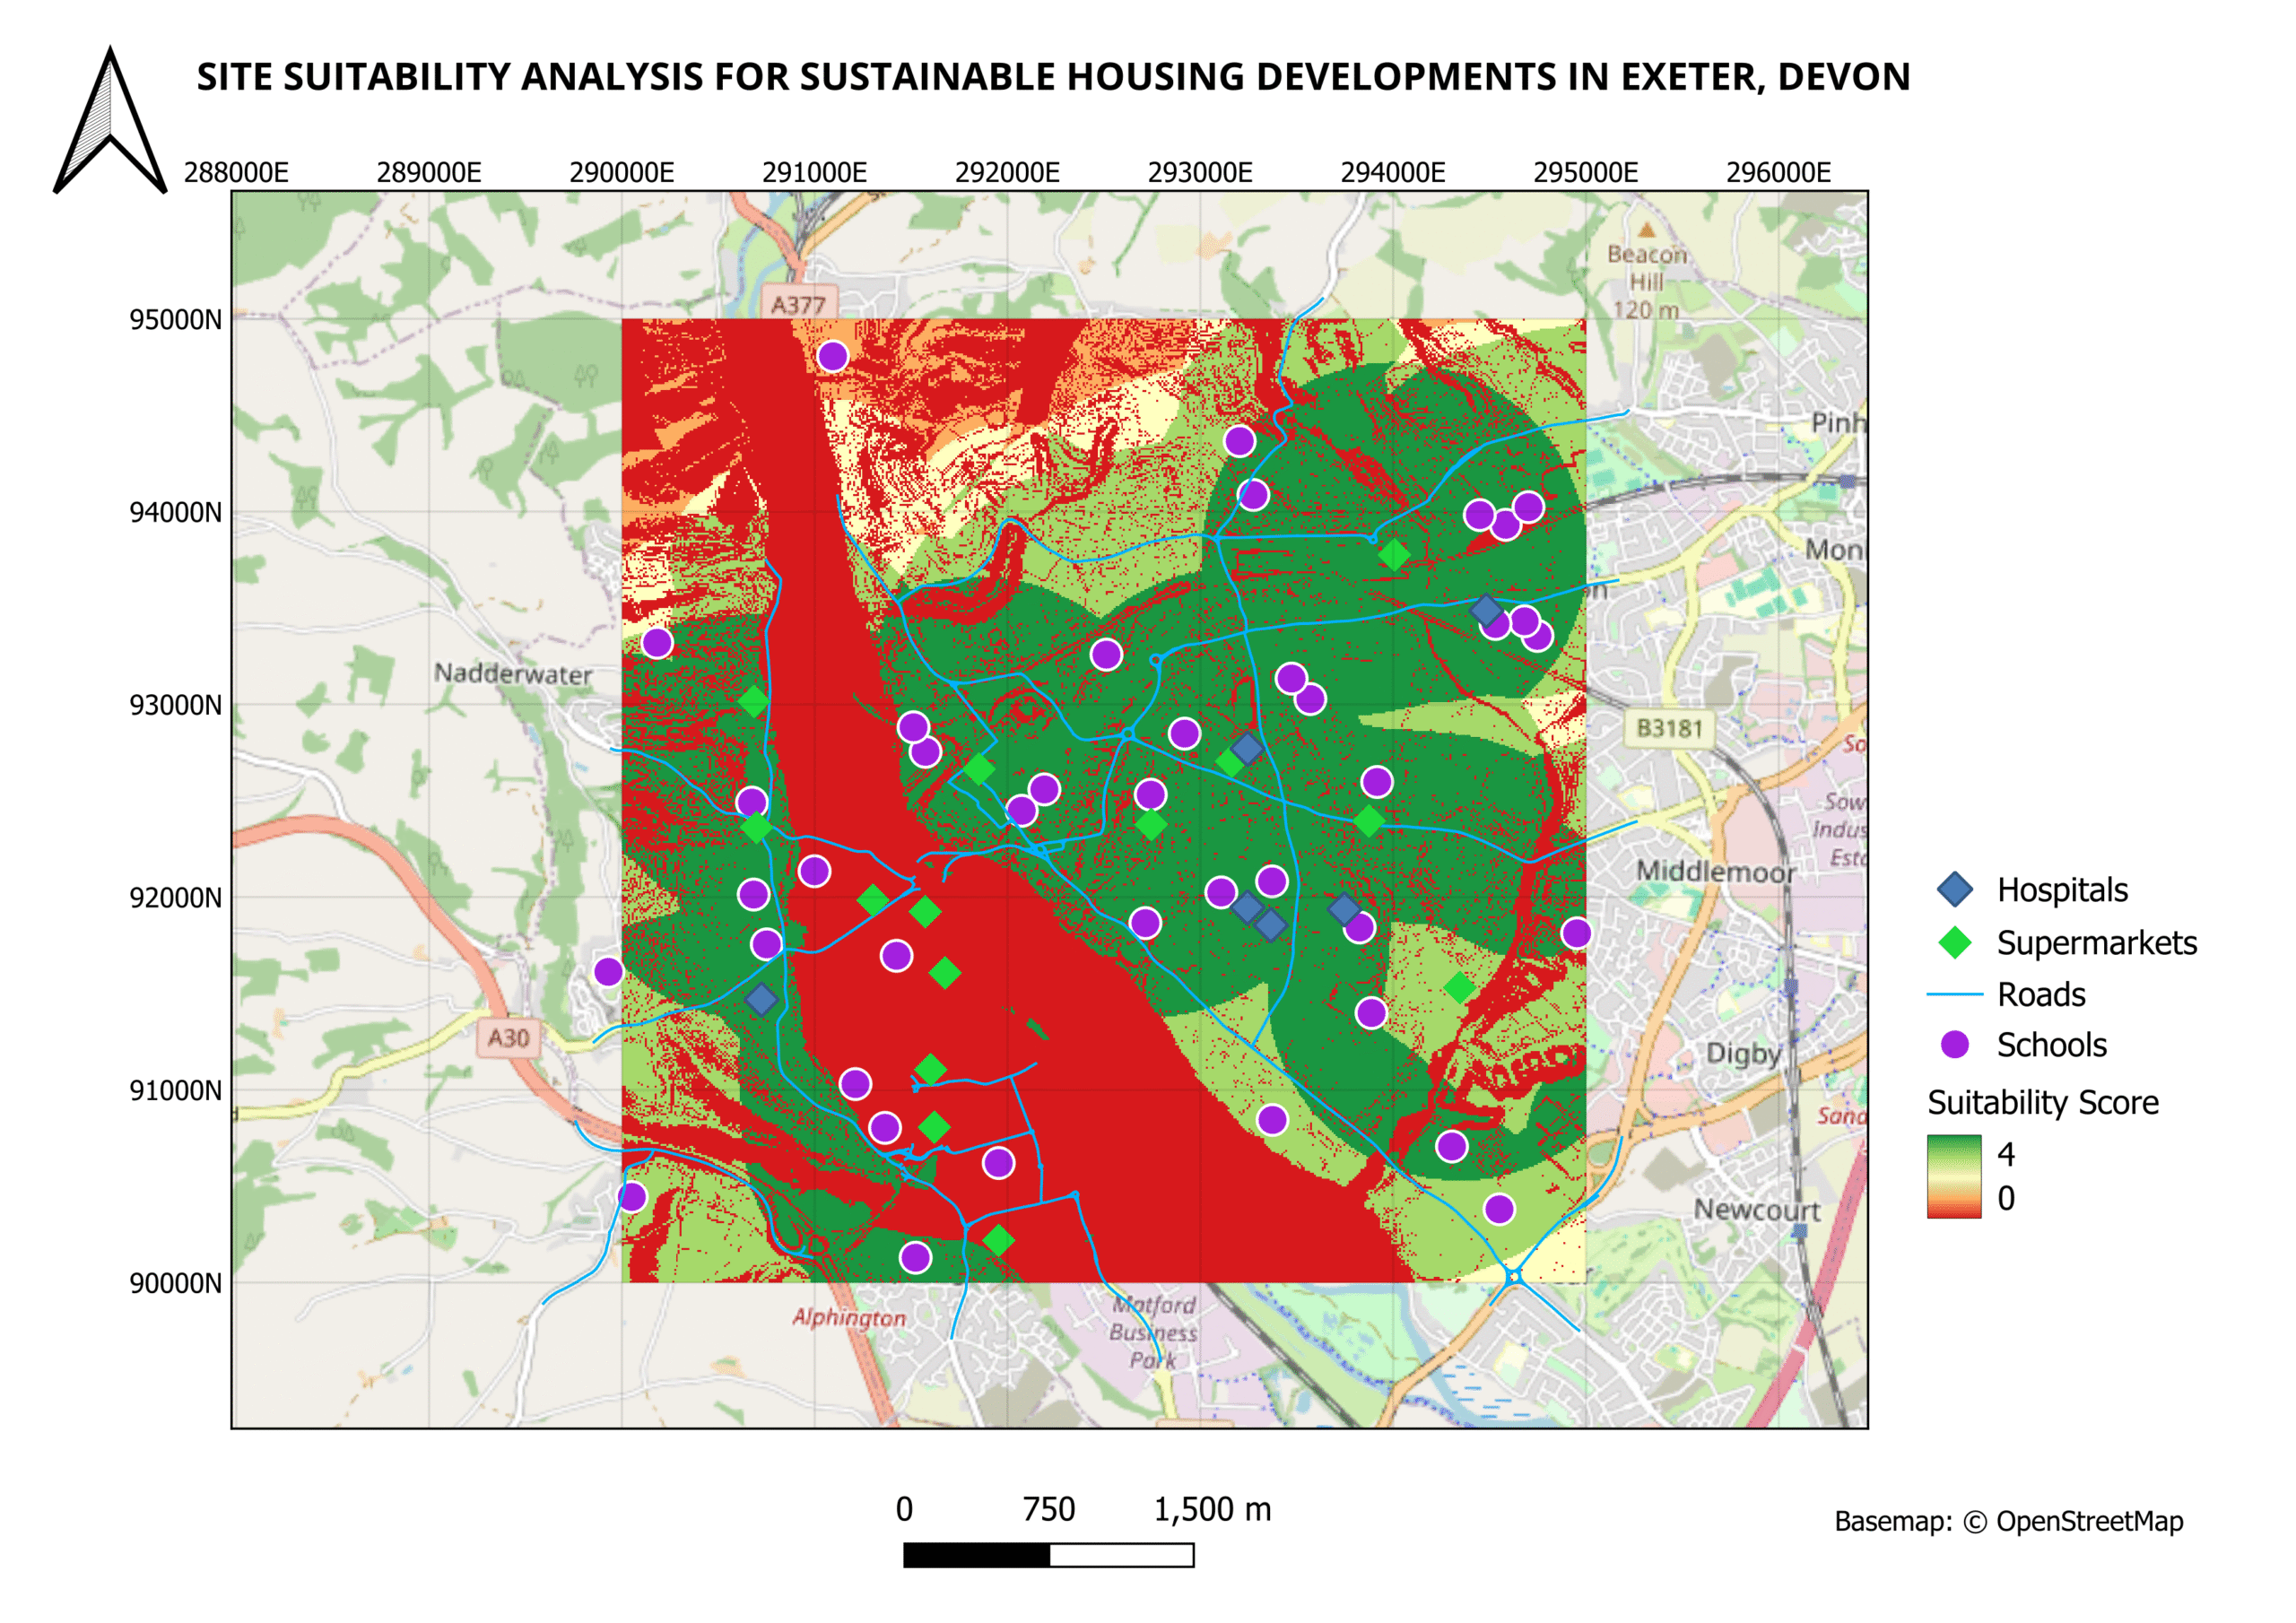
Unsurprisingly, most of the River Exe floodplain/Trew’s Weir area (Approximately 291,500E, 91,000N) are marked unsuitable with a score of 0. However, small isolated clusters of suitable (green) pixels appear within this channel (see figure 7). These likely correspond to elevated embankments or islands between the river and the ship canal which fall outside the specific Defra flood risk vector used. Technically, these areas are safe for sustainable housing developments due to the model used for this analysis. However, a human planner would likely reject these sites due to a lack of physical access, risk perception and zoning. This highlights the limitation of a purely automated workflow. This highlights the limitation of a purely automated workflow.
4.0 Conclusion
This analysis successfully demonstrated that R can be used to build an effective and automated site suitability model for sustainable housing developments. Performing this task using traditional GIS software such as QGIS or ArcGIS Pro would have taken twice the amount of time. Not only that, this model can be used for future analysis by just changing some values and variables and my results would be ready in minutes compared to spending several hours on desktop GIS software.
However, a key limitation of this analysis is the reliance on Euclidean (straight-line) distance. While proximity is a strong way to determine suitability, it does not account for the physical road network or barriers such as the River Exe, railway lines, or private land, which may significantly extend actual travel times. A site might be 400m from a school but require a 1.5km walk to reach the nearest bridge.
I intend to make modifications to this code in the future. This would include integrating network analysis using R packages like sfnetworks or osrm to calculate true walking distances along the street network. This would provide a more realistic assessment of sustainable travel and further enhance the effectiveness of the model for real-world urban planning. Additionally, while the current analysis successfully exports static maps for reporting, there is a potential for an interactive web map via a Shiny app. This would enable stakeholders to dynamically explore the data.
References
Department for Environment, Food & Rural Affairs (2024) Survey Data Download (LiDAR) and Risk of Flooding from Rivers and Sea (RoFRS). Available at: https://environment.data.gov.uk/ (Accessed: 28 November 2025).
Hijmans, R. J. (2024) terra: Spatial Data Analysis. R package version 1.7-71. Available at: https://cran.r-project.org/package=terra (Accessed: 28 November 2025).
Nash, A. (2019) National population projections: 2018-based. Office for National Statistics. Available at: https://www.ons.gov.uk/peoplepopulationandcommunity/populationandmigration/populationprojections/bulletins/nationalpopulationprojections/2018based/previous/v2 (Accessed: 30 November 2025).
Office for National Statistics (2021) How life has changed in Exeter: Census 2021. Available at: https://www.ons.gov.uk/visualisations/censusareachanges/E07000041/ (Accessed: 30 November 2025).
OpenStreetMap Contributors (2025) Planet dump. Available at: https://planet.osm.org (Accessed: 25 November 2025).
Padgham, M., Rudis, B., Lovelace, R. and Salmon, M. (2024) osmdata: Import ‘OpenStreetMap’ Data as Simple Features or Spatial Objects. R package version 0.2.5. Available at: https://cran.r-project.org/package=osmdata (Accessed: 25 November 2025).
Pebesma, E. (2018) ‘Simple Features for R: Standardized Support for Spatial Vector Data’, The R Journal, 10(1), pp. 439-446.
Prochorskaite, A., Couch, C., Malys, N. and Maliene, V. (2016) ‘Housing stakeholder preferences for the “Soft” features of sustainable and healthy housing design in the UK’, International Journal of Environmental Research and Public Health, 13(1), p. 111.
R Core Team (2024) R: A Language and Environment for Statistical Computing. Vienna, Austria: R Foundation for Statistical Computing. Available at: https://www.R-project.org/ (Accessed: 28 November 2025).
Savills (2025) English Housing Supply Update Q2 2025. Available at: https://www.savills.co.uk/research_articles/229130/380149-0 (Accessed: 30 November 2025).
Tennekes, M. (2018) ‘tmap: Thematic Maps in R’, Journal of Statistical Software, 84(6), pp. 1-39.
Wickham, H. et al. (2019) ‘Welcome to the Tidyverse’, Journal of Open Source Software, 4(43), p. 1686.